Human 7T cortical atlases
Introduction
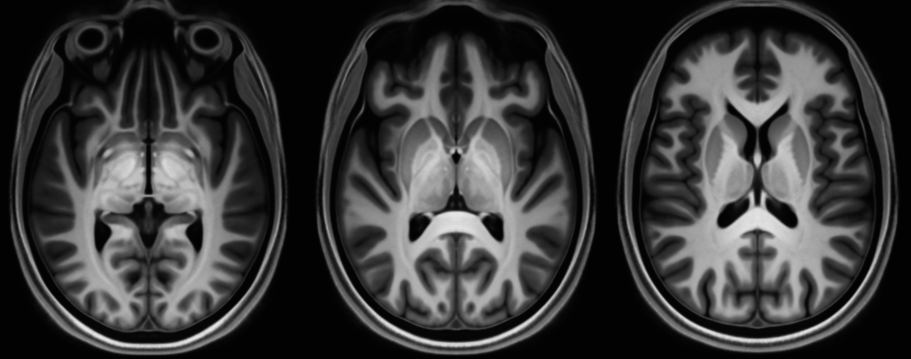
Digital MRI atlases serve to integrate data from differing modalities, stereotactic localisation, automated region identification, automated segmentation and direct comparisons between individuals [1]. While paper atlases can provide exquisite detail of delineated structures, they are typically based upon an individual subject’s histology and as such make it difficult to identify structures in novel subjects in an automated fashion. Below are a number of atlases generated via minimum deformation average (MDA) from a population of subjects based upon high resolution 7T MR imaging.
Method
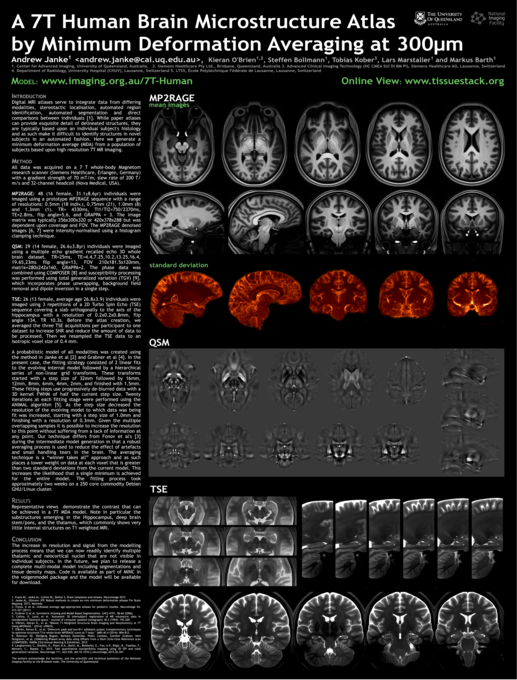
All data was acquired on a 7 T whole-body Magnetom research scanner (Siemens Healthcare, Erlangen, Germany) with a gradient strength of 70 mT/m, slew rate of 200 T/m/s and 32-channel headcoil (Nova Medical, USA).
A probabilistic model of all modalities was created using the method in Janke et al [2] and Grabner et al [4]. In the present case, the fitting strategy consisted of 2 linear fits to the evolving internal model followed by a hierarchical series of non-linear grid transforms. These transforms started with a step size of 32mm followed by 16mm, 12mm, 8mm, 6mm, 4mm, 2mm, and finished with 1.5mm. These fitting steps use progressively de-blurred data with a 3D kernel FWHM of half the current step size. Twenty iterations at each fitting stage were performed using the ANIMAL algorithm [5]. As the step size decreased the resolution of the evolving model to which data was being fit was increased, starting with a step size of 1.0mm and finishing with a resolution of 0.3mm. Given the multiple overlapping samples it is possible to increase the resolution to this point without suffering from a lack of information at any point. Our technique differs from Fonov et al’s [3] during the intermediate model generation in that a robust averaging process is used to reduce the effect of artefacts and small handling tears in the brain. The averaging technique is a “winner takes all” approach and as such places a lower weight on data at each voxel that is greater than two standard deviations from the current model. This increases the likelihood that a single minimum is achieved for the entire model.
Conclusion
The increase in resolution and signal from the modelling process means that we can now readily identify multiple thalamic and neocortical nuclei that are not visible in individual subjects. In the future, we plan to release a complete multi-modal model including segmentations and tissue density maps. Code is available as part of MINC in the volgenmodel package
There are currently 4 models available.
| Link | Description |
|---|---|
| MP2RAGE | MP2RAGE T1 style model |
| GRE/QSM | Model generated from QSM data |
| TSE | Turbo Spin Echo Hippocampal model |
| PETRA | PETRA model |
Please reference use of the model as such:
Janke AL, O’Brien K, Bollmann S, Kober T, Marstaller L, Barth M. A 7T Human Brain Microstructure Atlas by Minimum Deformation Averaging at 300um. In 24th Annual ISMRM Scientific Meeting and Exhibition, Singapore.
A copy of the poster can be downloaded here
References
- Evans AC, Janke AL, Collins DL, Baillet S. Brain templates and atlases. Neuroimage 2012
- Janke AL, Ullmann JFP, Robust methods to create ex-vivo minimum deformation atlases For Brain Mapping. 2015. Methods.
- Fonov, V. et al. Unbiased average age-appropriate atlases for pediatric studies. Neuroimage 54, 313-327 (2011).
- Grabner G et al. Symmetric Atlasing and Model Based Segmentation. LNCS 4191, 58-66 (2006).
- Collins, D. Louis, et al. “Automatic 3D intersubject registration of MR volumetric data in standardized Talairach space.” Journal of computer assisted tomography 18.2 (1994): 192-205.
- O’Brien, Kieran R., et al. “Robust T1-Weighted Structural Brain Imaging and Morphometry at 7T Using MP2RAGE.” (2014): e99676.
- O’Brien, Kieran R., et al. “Dielectric pads and low‐B1+ adiabatic pulses: Complementary techniques to optimize structural T1w whole brain MP2RAGE scans at 7 tesla.” JMRI 40.4 (2014): 804-812.
- Robinson SD, Wolfgang Bogner, Barbara Dymerska, Pedro Cardoso, Günther Grabner, Xeni Deligianni, et al. COMbining Phased array data using Offsets from a Short Echo-time Reference scan (COMPOSER). ISMRM 23rd Annual Meeting & Exhibition. 2015
- Langkammer, C., Bredies, K., Poser, B.A., Barth, M., Reishofer, G., Fan, A.P., Bilgic, B., Fazekas, F., Mainero, C., Ropele, S., 2015. Fast quantitative susceptibility mapping using 3D EPI and total generalized variation. NeuroImage 111, 622–630. doi:10.1016/j.neuroimage.2015.02.041 The authors acknowledge the facilities, and the scientific and technical assistance of the National Imaging Facility at the Brisbane node, The University of Queensland.